- Date
- 4th December 2023
- Categories
- Carbon Market Regulations, Clean Cooking, COP28, NDCs
By Dr Samir Thapa (MECS Programme, Loughborough University)
This is the third of three blogs that talk about the convergence of COP28 aspirations, the Carbon Market Regulations, and the Nationally Determined Contributions (NDCs) on cooking. This blog provides a snapshot of the Nationally Determined Contributions (NDCs) in relation to clean cooking promotion for some early-mover countries – Nepal, Kenya, Tanzania, Ghana, and Uganda. Table 1 shows the salient features for comparison. It shows that the economy-wide business-as-usual (BAU) emissions in 2030 are in the range of 140 MtCO2e except for Nepal. Nepal provides emission estimates only for the transport and residential cooking sector in its NDC. However, its Long-Term Low Emission Strategy published in 2021 shows that the total BAU emissions until 2030 are expected to reach 34 MtCO2e, much less than the other countries. This is because more than 95% of electricity generation is from hydro, and the emissions contribution of, especially the Agriculture, Forestry, and Land Use (AFOLU) sector is less (<50%) because of the forestry sector removals (45% land cover) affecting the net emissions. This trend is different compared to the other countries where contribution from the AFOLU sector is the highest e.g., in Uganda (>60%) and Tanzania (>60%). Ghana has not provided its BAU emissions but expects to reduce an absolute amount of 64 MtCO2e. Given the current country’s emissions are58.8 MtCO2e, it can be safely estimated that its BAU emissions will be in the range of the other African Countries.
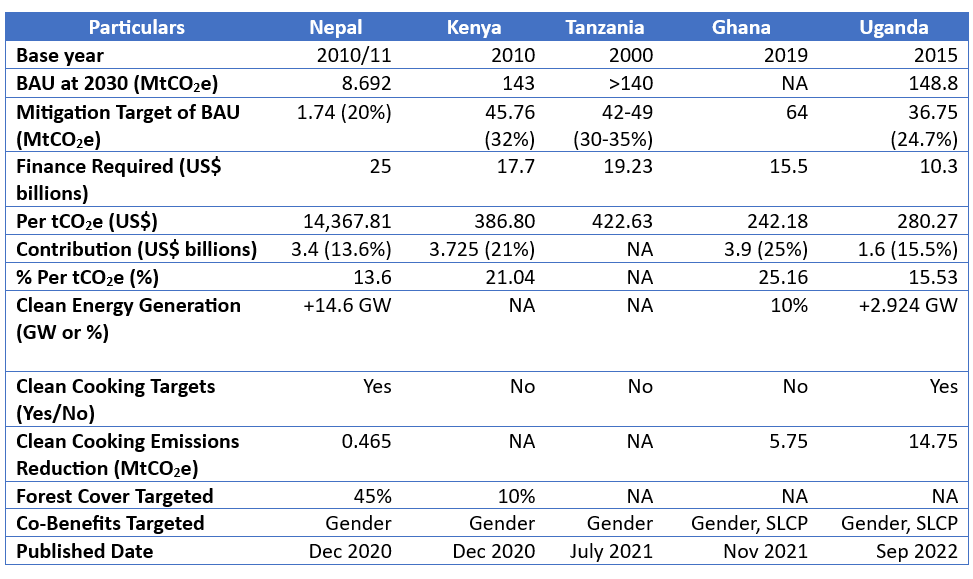
The mitigation targets are in the range of 20 to 35% of BAU emissions, with increased aspirations seen between the first NDC and the second updated NDC, including the financial contribution towards meeting these targets. For example, Uganda presents an ambitious economy-wide mitigation target in 2030 of 24.7% (36.75 MtCO2e) reduction, a progression from the 22% target in the first NDC in 2016. Similarly, compared to its 30% commitment in the first NDC, Kenya commits to reduce emissions by 32% (45.76 MtCO2e) including a financial contribution of US$ 3.725 billion, equal to 21% of the total estimated mitigation costs. In their NDCs, Kenya, Nepal and Ghana have neatly separated their mitigation costs, while Ghana and Tanzania have combined costs for Mitigation and Adaptation components. Only Tanzania has not expressed its share of the contribution towards NDC commitments. The country-level contributions compared to the overall finance required are in the range of 13 to 25%. For Nepal, Ghana and Uganda, these financial contributions are linked to the unconditional mitigation targets. Nepal expects to contribute 5GW of energy generation, and Ghana and Uganda to meet 24.6 and 8.78 MtCO2e (38% & 24%) of their mitigation targets. The per tCO2e mitigation costs are the lowest for Ghana and the highest for Nepal1. For the African nations, the cost per tCO2e is below US$ 500, where Ghana has the lowest cost even with the combined adaptation costs, and its mitigation contribution (unconditional) is the highest at 25% per tCO2e reduced.
Nepal, Ghana, and Uganda have stated their targets for clean energy generation. Nepal and Uganda expect to add 14.6 GW and 821.8 MW capacity from renewable energy. Also, Ghana and Nepal expect to meet 10 and 15 percent of the total energy demand with clean/renewable energy sources. Kenya and Tanzania both mention their large fossil fuel reserves, 400 Mt coal in Kenya and 57 trillion Cubic ft natural gas2 in Tanzania. While Kenya has committed in its NDC to forego coal and focus on renewables in the electricity generation mix, Tanzania plans to expedite the use of natural gas reserves to meet domestic demand, likely due to lower emissions. All the countries have committed to diverse renewable energy sources (geothermal, solar, wind, hydro, bioenergy). Only Nepal has committed to sourcing (up to 10%) from distributed mini-grids – likely due to the ongoing strong mini-grid program and its hilly and mountainous geography. However, all these targets fall below the expectation of reducing the emissions by 49% relative to 2019 BAU and tripling the share of renewables in the energy mix as per the SDG energy targets.
Nepal and Uganda have provided specific clean cooking targets. By 2025, Nepal seeks to achieve the installation of improved cookstoves in 500,000 households and domestic biogas in 200,000 households. Moreover, Nepal will ensure electric cooking as the primary mode of cooking in 25% households, by 2030. Uganda commits to increasing the share of households using clean and efficient cooking solutions to 10% by 2025, and the share of clean energy in cooking to 65% and electricity to 50% by 2030. Ghana, Uganda, and Nepal have also laid out the emission reduction potential of their cooking-related activities. Nepal’s clean cooking commitments will reduce 465,000 tCO2e which is low compared to Ghana and Uganda estimates of 5.75 and 14.75 MtCO2e respectively. This can be attributed to the contribution of the AFOLU sector e.g., in Uganda, its more than 90% – attributed to inefficient forest management, charcoal production, and fuelwood/charcoal stove use. However, ongoing discussion related to over-estimations due to methodological discrepancies in calculating baseline fuel and non-renewable biomass fraction, these figures could change with the NDC updates in 2025. Ghana has furthermore provided the cost of clean cooking mitigation measures estimated to be US$ 678.5 million, which is around 4.3% of the overall NDC costs.
1 Nepal’s net emissions potential from AFOLU is not included, but, since sizeable mitigation is expected to be with additional hydropower, the cost per unit tCO2e is expected to be higher than the average hydropower cost of US$ 20 per tCO2e (IEA, 2020) – even after considering the net AFOLU estimates.
2 100 million Cu. Ft. exploited to date to produce 527 MW, more than 90% of the installed capacity – 562MW.
……………………………..
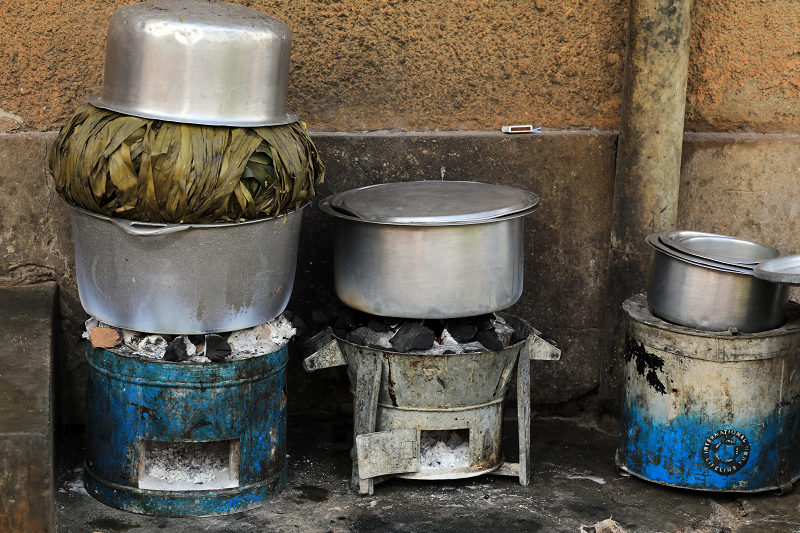
Featured image credit: Centre for Research in Energy and Energy Conservation (CREEC), 2022.