
- Date
- 23rd June 2025
- Categories
- Finance, Market Assessment, Policy & Strategy
By Simon Batchelor and Nigel Scott
The blog Beyond energy efficiency… who cares about 5 US Cents? discussed the role of inefficient ecook devices which could be cost effective compared to alternative fuels, depending on context specific relative fuel pricing. It noted that as MECS was reaching scale in some locations, particularly Asia, hotplates and infrared stoves were coming to the foreground. This was not because they had comparable energy efficiency to the energy efficient appliances we mainly talk about, but because they offered flexibility and were able to use existing cookware. In this blog we would like to explore the price point some more.
In the previous blog we noted that when the electricity tariff is very low or there is a large lifeline tariff, it creates a situation where even a cheap hotplate can cook food with less fuel cost than LPG, charcoal, or purchased wood. I cited the case of Bhutan which offers the first 100kWh lifeline amount free to its domestic customers, and 200kWh to those in more remote areas. Free is always cheaper than purchased alternative fuels!
Price parity charts
So what are the thresholds at which cooking ‘less’ efficiently on, say, an hotplate or infrared stove is still cheaper than LPG or charcoal?
The price parity charts below show the electricity tariff at which the cost of cooking with electricity is the same as cooking with LPG or charcoal[1].
These charts are based on energy consumption figures presented in a 2024 paper by Scott et al.[2] The paper draws on energy consumption data from a range of MECS studies and presents average figures for different cooking technologies and fuels across African and Asian countries. Although each of these studies has its own limitations, many are cooking diaries type studies, in which participants cook at home in their own kitchens, cooking the foods they normally cook, in the way they normally cook, and subject to the same distractions and interruptions that they normally experience. The results are, therefore, more representative of real world cooking behaviours than test protocols such as water boiling tests. The Energy ratios described in the paper are also regarded as a more realistic means of comparing the amount of different fuels needed than using thermal conversion efficiencies, which has been the most commonly used approach.
The price of the alternative fuels depends on context, so the x axis shows the range of possible prices for a kg of LPG and a kg of charcoal.
The charts are created by working out how many kWh of electricity would be needed to do the same amount of cooking as 1 kg of alternative fuel. The energy ratio represents the amount of energy used when cooking with an alternative fuel divided by the energy used when cooking with electricity. So the equivalent amount of electrical energy is calculated by dividing the energy in 1kg of alternative fuel by the energy ratio. This equivalent amount of electric cooking energy is expressed in kWh. Simply divide the alternative fuel price by the number of electricity units needed to arrive at the breakeven tariff rate (in USD/kWh).
For a given alternative fuel price, if the electricity tariff lies below the line then it is cheaper to cook with electricity, but if it is more than the breakeven price then it is cheaper to cook with the traditional fuel.
The charcoal graph is perhaps less precise than the LPG one as charcoal varies in quality as well as the data representing different types of charcoal stoves. If for instance the charcoal was being used in a particularly energy efficient improved stove then the price parity lines would all drop down a bit, meaning that the tipping points would occur at lower tariff rates, i.e. tariffs would need to be a bit lower for eCooking to be cheaper than charcoal on that particularly efficient stove.
LPG – some country specific examples
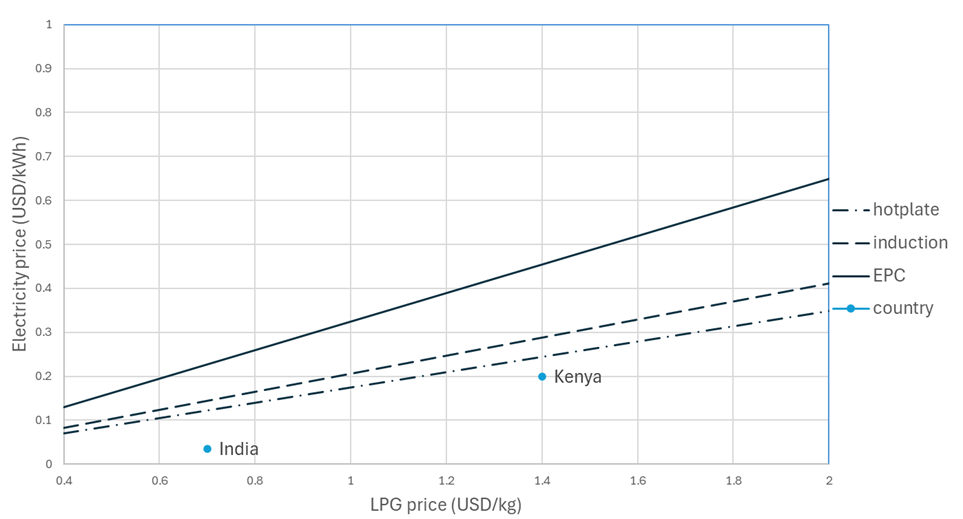
Figure 1 Price parity chart for electricity and LPG (based on Asian cooking) (Created by authors 2025, Derived from Scott et al 2024).
In India, subsidised LPG is of the order USD 71 cents per kg and the domestic tariff in Delhi up to 200kWh is USD 3.5 cents. This is therefore an example of where even an infrared stove (or hotplate) would be much cheaper than using LPG. The size of the saving would increase if the user focused their cooking on using an EPC.
Kenya offers its LPG in of the order USD1.8 per kg and the lifeline tariff is USD 13 cents up to 30 units, thereafter it is USD16 cents up to 100kWh, and then it increases again for the D2 tariff at about USD22 cents. There will also be standing charges, to lets plot between USD20 cents. Even at 20 cents, the intersect of the electricity with the LPG refill price is just below the hotplate/infrared break even line. In contrast the EPC gives clear savings. It is interesting that from our experience, those promoting induction found the Kenyan tariff slightly too high and have been lobbying for a reduction. That’s not surprising given the graphs. While there is a saving, it is perhaps too small to send a clear price signal to the consumer. We do now have data from a substantial number of induction stoves and they do show very clear savings when compared to the previous monthly expenditure on LPG. Bhutan, as stated in the previous blog, Bhutan actually gives a lifeline of 100 units free to all domestic users, and 200 units (kWh) to the more remote households. I don’t think we need to refer to the graph to show that free is better than paid for LPG! And in Bhutan the replacement of cylinders is a challenge due to the geography and resulting transport costs. The LPG is sourced from India, and India offers a subsidy to Bhutan – however, as the link article suggests Bhutan is reluctant to rely long term on this foreign exchange imbalance and without the Indian subsidy, the price of the LPG is not so attractive to the consumer.
Charcoal – Some country specific examples
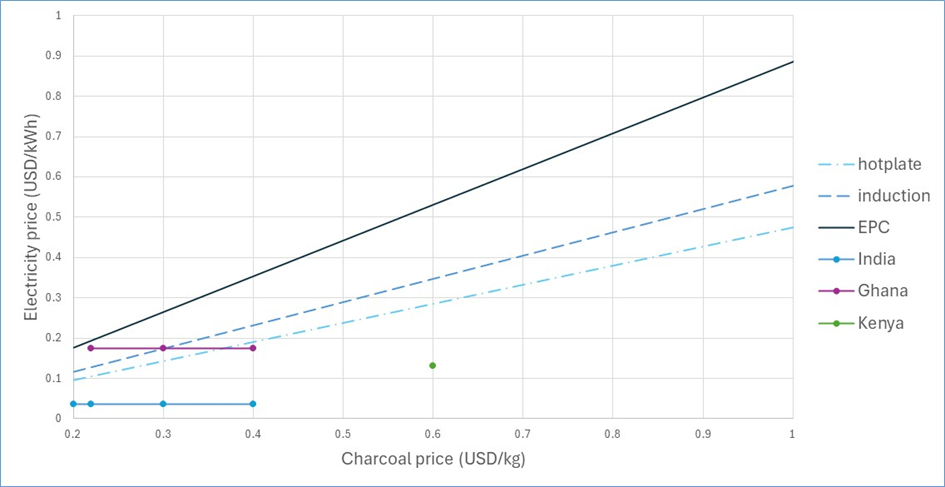
Figure 2 Price parity chart for electricity and charcoal (based on Asian cooking) (Created by authors 2025, Derived from Scott et al 2024)
We can do the same exercise for charcoal, although the variance of charcoal prices is much more that LPG, not just because of seasonal supply and demand but also with the economic ebb and flow (labour costs, transport costs, etc). There are also strong differences geographically, with higher prices in major cities, and lower prices in more rural areas[1].
So identifying a few price points on the global internet…. In August 2024, charcoal hit USD 64 cents per kilogram in Kenya. This was said to be a four year high, so perhaps we can plot USD 60 US cents as the norm.
Illustrating the geographical diversity of price, the Energy Outlook 2025 for Ghana reports (USD added as at exchange rate 06/06/2025) “The average national price per kilogram of charcoal stands at GH₵ 2.27 (USD 22 cents). Cape Coast reported the highest price per kilogram at GH₵ 4.24 (USD 41 cents), followed by Koforidua (GH₵ 3.98) and Takoradi (GH₵ 3.66). Conversely, Nalerigu recorded the lowest price per kilogram at GH₵ 1.24 (USD 12 cents) , followed by Tamale at GH₵ 1.33, and then Kintampo at GH₵ 1.36.”
The parity chart shows that if the charcoal is between 12 and 40 cents per kg, then at the mid and high range of charcoal prices, and given the cost of electricity in Ghana is 17.4 cents per kWh, a hotplate, infrared or even an induction stove does not present a clear cheaper option. However, when the charcoal is only USD 12 cents, electricity on a hotplate, infrared or even an induction stove is the greater monthly fuel cost, so it is clearly cheaper to cook with charcoal at this price. However, with its additional energy efficiency an EPC is cheaper across the range of charcoal prices; perhaps only when the charcoal is at 12 cents will there be some debate about the cost savings.
It has been more difficult to find recent charcoal prices for India, partly again because of the, in this case huge, geographic differences, but also the seasonal and quality variance. From a 2016 academic paper (Arya 2016), we can see that Low Quality: ₹20 per kg (~$0.24 USD); Medium Quality: ₹30 per kg (~$0.36 USD); High Quality: ₹40 per kg (~$0.48 USD)
In Manipur, a region with significant charcoal usage, a 35 kg bag of charcoal was priced at ₹550 in 2019–2020, equating to approximately ₹15.7 per kg (~$0.19 USD). This price reflects rural market conditions. A 2025 study focusing on charcoal production in Manipur reported a 90% increase in charcoal prices, reaching ₹1,200 per 35 kg bag. This equates to approximately ₹34.3 per kg (~$0.41 USD). The study attributes this price surge to increased demand and challenges in supply chains.
So plotting these on the chart, we find that given the low electricity tariff in India, electricity is a very strong cost effective proposition even with a hotplate or infrared appliance.
As the blog Beyond energy efficiency… who cares about 5 US Cents? said, MECS focuses on energy efficiency because part of Sustainable Development Goal 7 includes a target of doubling the global rate of improvement in energy efficiency and it is an essential part of economic growth. A transition from polluting biomass fuels to modern energy cooking should seek to maximise the efficient use of that modern energy. However, the price point is the key signal to the consumer and since, as seen above, it is indeed cheaper to cook on a hotplate or infrared stove than charcoal and LPG, and since both the hotplate and infrared require less upfront cost than induction and EPC, then we should not be surprised if we see the transition to modern energy cooking including these devices.
If it saves consumers on their monthly fuel costs AND it provides a healthier pollution free kitchen then perhaps the use of these devices should be supported and utilized within the changing cooking ecosystem.
[1] For energy planning modellers, physicists and those doing carbon calculations, it is important to note that this is based on measured amounts of energy used to cook meals, not simply assuming that all fuels deliver the same ‘useful’ energy, which is calculated by multiplying the energy content in the fuels by a stove efficiency – it includes the way food is cooked.
[2] https://www.mdpi.com/1996-1073/17/13/3318
[3] In the life of MECS there have been several attempts to document the range of charcoal pricing in both specific countries and across multiple countries. They have all failed to produce an accurate and useable database, because or variations in charcoal quality, the different types of packaging (bags, sacks, tins), the means of sales (volume or weight), etc.